
Pokémon Type Predictions with Base Stats and Image Classification
Is there a way to predict the type of a Pokémon based on its base stats and image?
Introduction
The strategy to beating Pokémon is to figure out the type of the Pokémon and then use moves that are super effective against it. Once a player knows what types are effective, the concept of winning Pokémon battles is pretty easy.
What patterns can a player find to predict the type of a Pokémon he has never seen before? One way is to make predictions based off its name. For example, “Beautifly” is probably a butterfly, and butterflies are bugs and can fly. Therefore, a player might conclude that Beautifly are Bug/Flying type, which is correct. The methods I will use to predict a Pokémon’s type are base stat ratios and image classification. The reason for exploring multiple models is that no single model performs well in every situation. Therefore, it is good to implement different models. The data I used for the analysis are from the PokeAPI website and a Kaggle dataset of Pokémon images.
Exploratory Data Analysis (EDA)
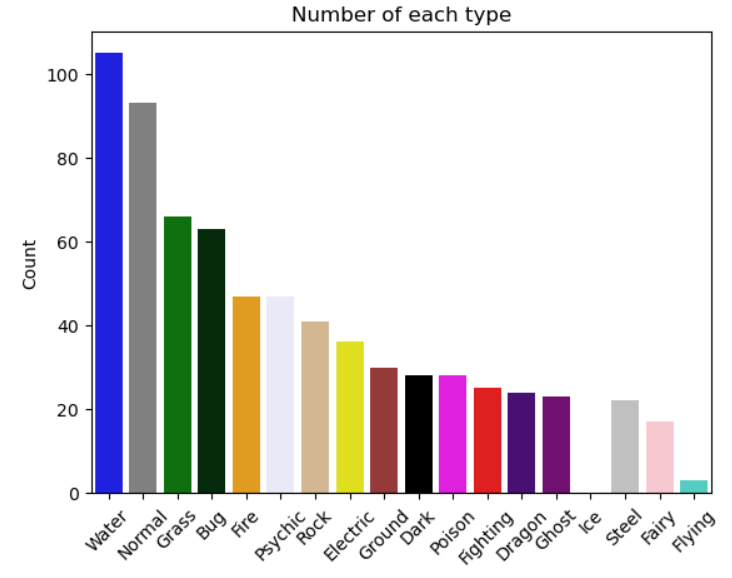
This article has some great approaches to EDA for the image classification dataset. I really liked the visualization of the different types for each Pokémon. For simplification, only the first type is used to classify the type of a Pokémon. According to the plot, water types are most common in the Kaggle dataset, while flying is the least common.
From the data scraped off the PokeAPI website, any Pokémon game player knows that evolved forms of Pokémon have higher base stats than their pre-evolved forms. To avoid the issue of the wide ranges of base stats among a Pokémon and its evolved forms, I used ratios of base stats. For simplicity, I divided all base stats by speed except for speed itself. In a way, it “standardizes” the base stats. For example, Charmander has base stats of 52 for attack and 65 for speed, while its most evolved form Charizard has base stats of 84 for attack and 100 for speed. Charmander’s base stats are much lower than Charizard’s, even though they are both Fire type. Attack divided by speed gives Charmander a .80 ratio and Charizard a .84 ratio, which are much more similar.
You can also take a look at my EDA blog post for more insights into the PokeAPI website’s data.
Best Models
The models for classifying one of the 18 types had much lower accuracy than comparing between two types. I will focus more on the performance of the binary classification models.
Image Classification Dataset: Convolutional Neural Network (CNN)
I used convolutional neural network and feed forward neural network models.
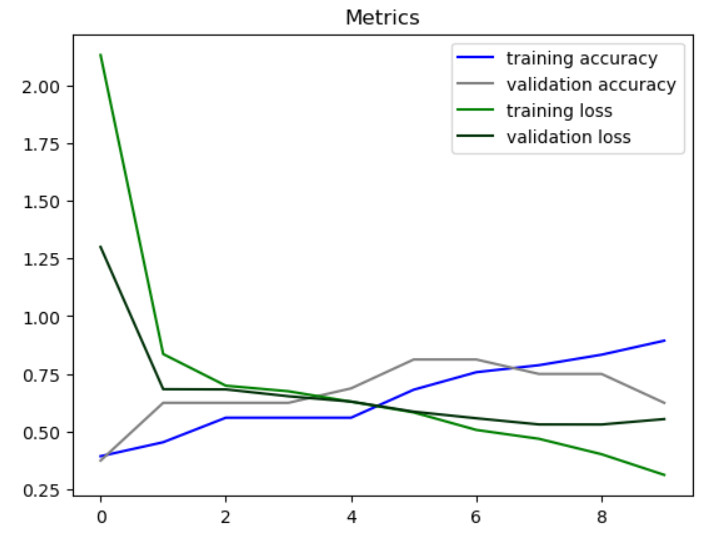
A CNN is a neural network especially designed for recognizing patterns in image data. Hyperparameters I considered include the activation function, input shape, and number of hidden layers. When evaluating the model on predicting from all 18 types, the testing accuracy is only .14. When evaluating the model on just two types, specifically Bug vs. Fire, the testing accuracy is .71. The graph below shows the accuracy and loss metrics for both the training and validation datasets.
PokeAPI Website Dataset: K-Nearest Neighbors (KNN)
I used KNN, decision tree, random forest, and ensemble models.
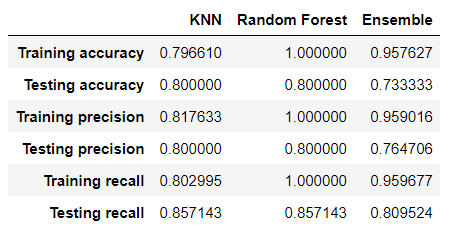
KNN classifies a new data point based on a distance metric from the k closest data points. Hyperparameters include the number of neighbors (k) and the distance metric. When evaluating the model on predicting from all 18 types, the testing accuracy is .23. When evaluating the model on just two types, specifically Bug vs. Fire, the testing accuracy is .8. It’s surprising that KNN performs the best because I would’ve expected an ensemble model to perform better. Below are metrics for accuracy, precision, and recall for the KNN, random forest, and ensemble models.
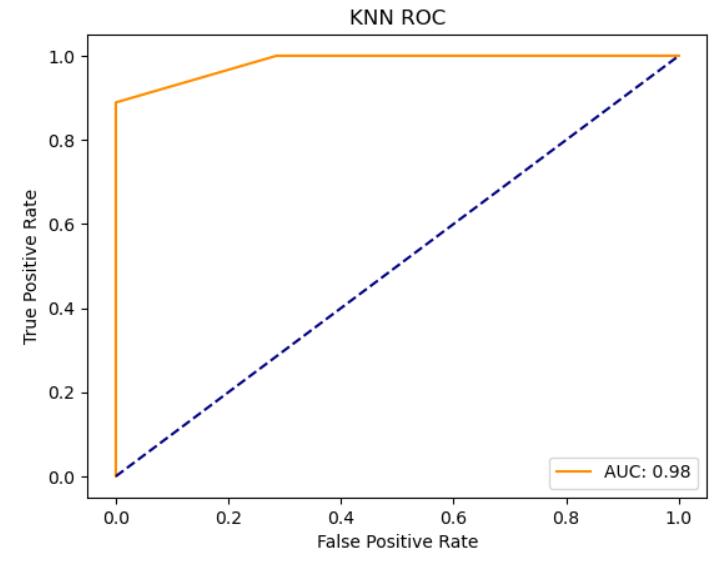
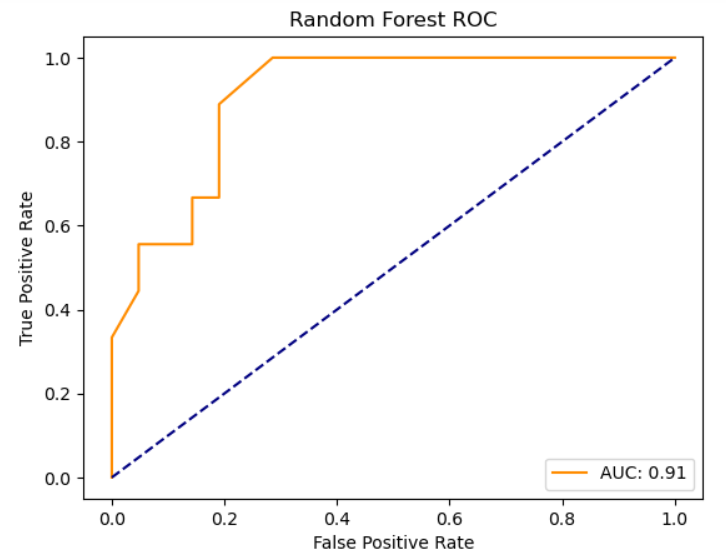
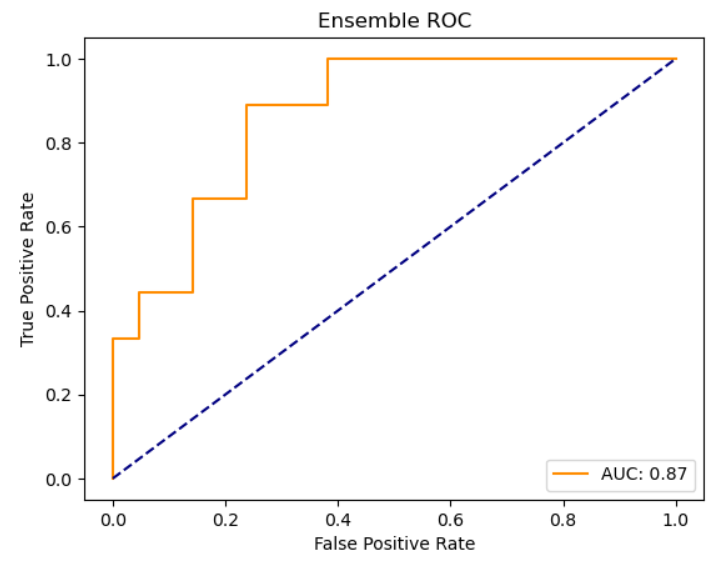
Below are the ROC curves for the KNN, random forest, and ensemble models, respectively:
Possible Future Work
As far as potential future steps, I would do binary classification for all combinations of two types and compare the models’ metrics. Maybe the model performances will be different, and the random forest model or the ensemble model may outperform KNN. I also think it would be interesting to figure out a way for a model to take the two types that have the highest probability for being predicted and then to run the model again on just those two types. That way, the model may have better prediction metrics; the common theme is that binary classification models perform a lot better than models that try to predict one of the 18 types.